Frequency domain specifications, Frequency Response Analysis
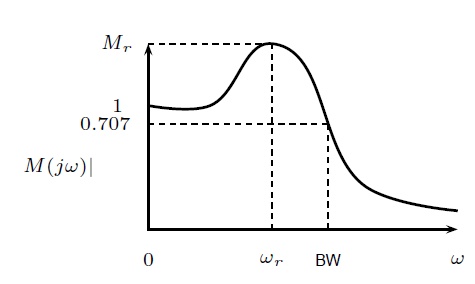
Table of Contents
Frequency domain specifications, Frequency Response Analysis
What is Frequency Response?
A system’s response can be divided into two categories: the transient response and the steady state response. Using Fourier integrals, we are able to determine the transient response. So The frequency response of a system is its steady-state response to an input sinusoidal signal. We will only address the steady state response in this chapter.
So A linear time-invariant (LTI) system generates a sinusoidal signal as its steady state output if a sinusoidal signal is applied as the system’s input. The frequency of the input and output sinusoidal signals is the same, but their amplitudes and phase angles are not the same.
Let the input signal be −
r(t)=Asin(ω0t)
The open loop transfer function will be −
G(s)=G(jω)
We can represent G(jω) in terms of magnitude and phase as shown below.
G(jω)=|G(jω)|∠G(jω)
Substitute, ω=ω0 in the above equation.
G(jω0)=|G(jω0)|∠G(jω0)
The output signal is
c(t)=A|G(jω0)|sin(ω0t+∠G(jω0))
- The amplitude of the output sinusoidal signal is obtained by multiplying the amplitude of the input sinusoidal signal and the magnitude of G(jω) at ω=ω0.
- So The phase of the output sinusoidal signal is obtained by adding the phase of the input sinusoidal signal and the phase of G(jω) at ω=ω0.
Where,
- A is the amplitude of the input sinusoidal signal.
- ω0 is angular frequency of the input sinusoidal signal.
So We can write, angular frequency ω0 as shown below.
ω0=2πf0
So The input sinusoidal signal’s frequency, f0, is indicated here. For a closed loop control system, you can use the same process.
Frequency Domain Specifications
Resonant peak, resonant frequency, and bandwidth are the specifications for the frequency domain.
Frequency domain specifications
The resonant peak Mr is the maximum value of jM(jw)j.
So The frequency at which the peak resonance Mr takes place is known as the resonant frequency !r.
And So The bandwidth BW is the frequency at which(jw) drops to 70:7% (3 dB) of its zero-frequency value.
So A stable closed loop system’s relative stability is indicated by Mr.
A large Mr is correlated with a larger step response’s maximum overshoot. Value range desired: 1.1 to 1.5
so The transient response characteristics of a control system are indicated by BW.
So Faster rise times are correlated with larger bandwidths. The relationship between BW and rise time (tr) is inverse.
BW also reveals the system’s robustness and noise-filtering abilities. BW rises as wn increases.
Mr. and BW are in proportion to one another.